The probability of success is difficult to estimate; but if we never search the chance of success is zero.
Phillip Morrison

A Venn diagram is a diagram that shows all possible logical relations between a finite collection of different sets. These diagrams depict elements as points in the plane, and sets as regions inside closed curves. A Venn diagram consists of multiple overlapping closed curves, usually circles, each representing a set.
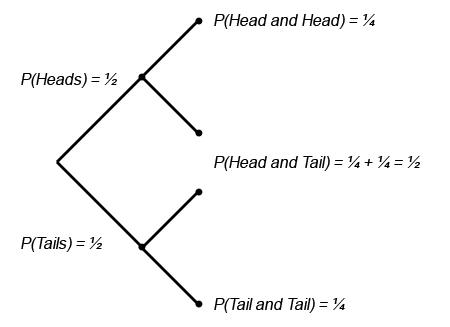
A tree diagram depicts the many different probabilities of an event, each branch showing the probability of each possible outcome. For example, when a coin is flipped, the outcome is either heads or tails. The tree diagram above shows the possible outcomes when the coin is flipped twice.
REAL LIFE APPLICATION OF SETS

Representative houses are examples of sets. Here the people belonging to various departments have to sit separately from other departments. For example, the legal department and finance department dont sit intermixed with each other. It has the lower house and upper house called Senate, where only senior members sit whereas the juniors sit in the lower house.

As we all know that there are millions of galaxies present in our world which are separated from each other by some distance. Here, the universe act as a set.
REAL LIFE APPLICATION OF PROBABILITY

Many politics analysts use the tactics of probability to predict the outcome of the election’s results. For example, they may predict a certain political party to come into power; based on the results of exit polls.
There is a probability of getting a desired card when we randomly pick one out of 52. For example, the probability of picking up an ace in a 52 deck of cards is 4/52; since there are 4 aces in the deck. The odds of picking up any other card is therefore 52/52 – 4/52 = 48/52.

The blog is missing a lot of information about the topic, resulting in a short comment, but at least I can get interesting real life applications of it. 🙂
LikeLike