“Facts are stubborn things, but statistics are pliable”
~ Mark Twain

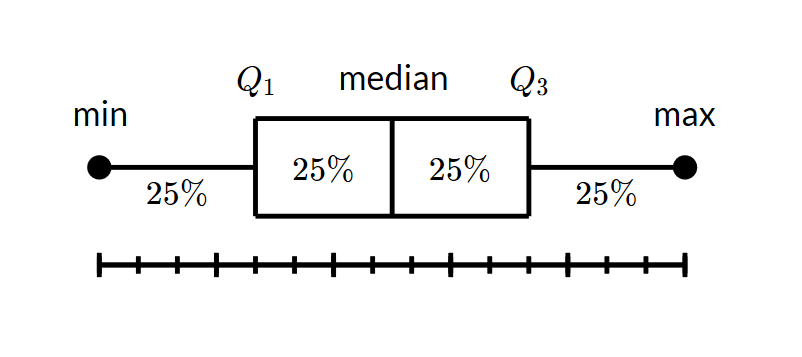
Source: https://datavizcatalogue.com/methods/box_plot.html
Above is a box and whiskers diagram. A box and whisker diagram is a way of summarising a set of data measured on an interval scale. It is often used in explanatory data analysis. The points needed to plot a box and whiskers diagram are the minimum and maximum points, the lower and upper quartile, and the median.
Box and whisker diagrams are ideal for comparing distributions because the centre, spread and overall range are immediately apparent.
In a box and whisker plot:
- the ends of the box are the upper and lower quartiles, so the box spans the interquartile range
- the median is marked by a vertical line inside the box
- the whiskers are the two lines outside the box that extend to the highest and lowest observations.
Lower quartile (Q1): ¼(n+1)
Upper quartile (Q3): ¾(n+1)
Median (Q2): ½(n+1)
where n is the total frequency.
The “whiskers” of the diagram is basically the minimum frequency and the maximum frequency.
In the box and whiskers diagram, the position of the median (of the frequency) is where the middle line is drawn.
Outliers are the values that lie outside ( is much smaller than or larger than) most of the other values in a set of data, which is represented by a dot in the box and whiskers diagram.
Real life application 1: An overview of students’ performance in a test.

Source: https://www.ck12.org/statistics/Box-and-Whisker-Plots/lesson/Box-and-Whisker-Plots-MSM6/
In this box and whisker diagram, the minimum mark a student received is 68 while the maximum mark a student received is 97. The lower quartile mark is 77 and the upper quartile mark is 93. The median mark of the test is 85.
Real life application 2: Comparing the number of computers sold by Store 1 and Store 2.

Source: http://intellspot.com/box-and-whisker-plot-examples/
STORE 1
Minimum number of computers sold: 20
Maximum number of computers sold: 580
Median number of computers sold: 270
Lower Quartile: 180
Upper Quartile: 420
STORE 2
Minimum number of computers sold: 70
Maximum number of computers sold: 160
Median number of computers sold: 320
Lower Quartile: 470
Upper Quartile: 630
So, what can we deduce from the data given?
Store 2 has a higher maximum and minimum number of computers sold than Store 1. Moreover, Store 2 has a higher median and interquartile range than Store 1. Thus, it is evident that Store 2 had consistently sold more computers than Store 1.

I did box and whiskers diagram once in excel when I was secondary 4, and I took a lot of time to finally understand how to implement it in my spreadsheet. I like how you’ve explained in detail how the box and whiskers diagram works, and at the same time you have organized the information well so it is pleasing to the eyes. Thank you for the great blog!
LikeLike